
I’ve just finished rereading The Limits to Growth (LtG), a book that the Malthusian pessimists love and the technological optimists hate. Here I’d like to offer a few thoughts that are more nuanced.
(Many volumes have been written in response to LtG, and I have nothing original to add; I just think certain points deserve a little more attention.)
Let’s first be clear on what LtG is and is not.
Unlike some other books about population and growth that appeared in the 1960s and 70s, LtG did not breathlessly scream that our planet was already overpopulated, or that widespread famines or other disasters resulting from overpopulation would occur within mere decades. Nor was it concerned about a very distant future, when unforeseeable technologies might be at humanity’s disposal.
Instead, LtG looked at a century-long time scale, and used abstract mathematical projections to argue that the growth rates prevailing in 1970 couldn’t be sustained on that kind of time scale. Here are the book’s conclusions, quoted directly from pages 23-24:
1. If the present growth trends in world population, industrialization, pollution, food production, and resource depletion continue unchanged, the limits to growth on this planet will be reached sometime within the next one hundred years. The most probable result will be a rather sudden and uncontrollable decline in both population and industrial capacity.
2. It is possible to alter these growth trends and to establish a condition of ecological and economic stability that is sustainable far into the future. The state of global equilibrium could be designed so that the basic material needs of each person on earth are satisfied and each person has an equal opportunity to realize his individual human potential.
3. If the world's people decide to strive for this second outcome rather than the first, the sooner they begin working to attain it, the greater will be their chances of success.
To make their projections, the LtG authors (Donella Meadows, Dennis Meadows, Jørgen Randers, and William Behrens) used a computer simulation code (called World3), which modeled the interrelated behavior of the quantities they listed in conclusion 1 above: global population, industrial output, pollution, food production, and resources (raw materials and energy). They fit the simulation parameters to data from 1900 through 1970, then ran the simulation forward to the year 2100. Acknowledging that many of the model parameters were uncertain, they carried out a variety of model runs using different parameters. The book emphasizes that these model runs are not quantitative predictions. Rather, they are scenarios used to explore what general types of behavior are possible and how the various parameters tend to affect that behavior.
Over a wide range of parameter choices, these modeling runs produced behavior that the authors call “overshoot and collapse”: population and industrial output would rise for a time, reach a peak, and then fall rapidly. Here is their first example (Figure 35, page 124):

After pausing to admire the advanced computer graphics of 1972, notice what’s happening here: growth continues into the early 21st century, but then dwindling resources cause industrial output and food production to turn sharply downward. Population keeps rising for a few decades (“overshoot”), because the time scale of these downturns is much shorter than a human life span. But the death rate (which I’ve highlighted in pink) soon skyrockets due to shortages of food and medical services, causing population to peak and then decline. By 2100 the industrial era has ended, leaving humanity in a state of widespread hunger and short life expectancy (“collapse”).
Again, the point here is not this projection's specific dates or numerical values. It’s easy to change these details by making different assumptions about resource levels, crop yields, and/or pollution controls. The problem is that both population and industrial activity are growing exponentially as long as there are no physical constraints, and the authors found no way for earth’s bounty to outrun that exponential growth.
Many criticisms of LtG have focused on the constraints. These critics argue that energy and mineral resources are vastly greater than the LtG authors assumed, even in their most optimistic model runs; that pollution can be controlled much more effectively; and that crop yields can grow even more in the future than they have in the past. I think it’s now apparent—thanks to 50 more years of data—that all these things are true. But I don’t see how any of these factors, or even all of them together, could do more than delay the overshoot and collapse behavior into the 22nd century. It’s really hard to outrun exponential growth!
So to get at the heart of the LtG argument, I think we need to focus on the exponential growth itself. Is it really true that both population and industrial production will, if left unconstrained, grow exponentially?
Population
In 1972 it was natural to answer yes. Population growth during the preceding decades was actually super-exponential, with a rising annual percentage increase that by then had reached 2%. I’m too lazy to dig into the World3 code, so I don’t know exactly what assumptions about unconstrained population growth it makes, but the authors must have tuned it to match this 2% growth rate in 1970, and their results seem consistent with the assumption that the rate doesn’t change much until the constraints kick in.
Let’s look at what would have happened if population had continued to grow at 2% per year from 1970 onward:

As the red curve shows, population would have risen from 3.7 billion in 1970 to 10 billion in 2021, and would continue rising to 18 billion in 2050, 27 billion in 2070, and 48 billion in 2100. That’s the type of exponential growth the LtG authors were so concerned about.
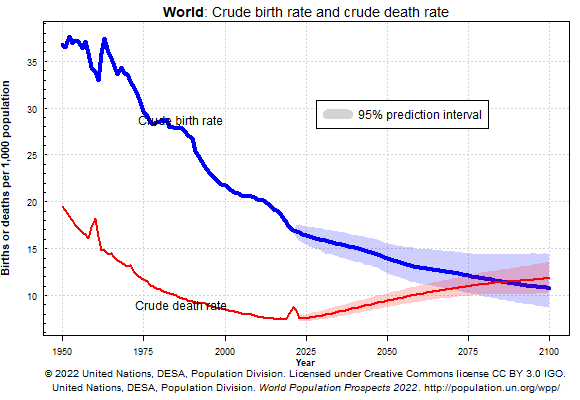
Yet as you can see, that’s not what is happening. Although population has continued to grow, we were still below 8 billion in 2021. The annual percentage growth rate has dropped to less than 1%. Fertility rates are now below replacement level in the Americas, Europe, and Asia, and are falling steadily in Africa. The United Nations projects that world population growth will continue to slow over the coming decades and will probably end late in the present century, with a peak slightly above 10 billion. (Other researchers project a somewhat earlier and lower peak.)
Now a Malthusian might argue that this slowed growth is a sign of resource constraints already taking their toll, as in the LtG model run shown above. That sounds plausible at first, but it’s not consistent with the facts. Resource shortages are not causing industrial output to plummet. Per-capita global food production is higher than ever. Population growth has slowed due to falling birth rates, not rising death rates. And it has slowed the most in wealthy and middle-income countries, where any hypothetical global resource shortages would be felt the least.
So what’s causing birth rates to fall? The main factors are now pretty well understood. Economic development, urbanization, education, integrating women into the labor market, and decreased child mortality have all contributed to reducing the desired number of children per family. The Limits to Growth doesn’t enumerate these factors, though it does seem to suggest that the model incorporates them collectively, to some degree:
A changing industrial output per capita also has an observable effect (though typically after a long delay) on many social factors that influence fertility. (page 101)
The LtG model also incorporates a further factor—access to contraceptives—that can close the gap between desired and actual family sizes. But it seems clear today, in hindsight, that the model greatly underestimated the impact of “social factors” on birth rates, and/or overestimated the delay of this impact.
More prominent in LtG is the suggestion that lowering the birth rate would require “deliberate” society-wide efforts:
All of the “natural” constraints to population growth operate [by raising] the death rate. Any society wishing to avoid that result must take deliberate action to control the positive feedback loop—to reduce the birth rate. (page 159)

In fact, since the 1960s many societies have taken deliberate action to reduce birth rates. These deliberate actions have emphasized public education campaigns, including the 1972 U.S. stamp that was my first exposure, at age 10, to the term “family planning”. But the actions of some governments went further, to include coercion. And near the end of the book, the LtG authors implied that some amount of coercion would be needed:
Equilibrium would require trading certain human freedoms, such as producing unlimited numbers of children or consuming uncontrolled amounts of resources, for other freedoms, such as relief from pollution and crowding and the threat of collapse of the world system. (pages 179-180)
Again with the benefit of hindsight, it seems clear today that coercion was not necessary—let alone morally acceptable—for lowering birth rates. Where it was used, it probably had little long-term effect. Non-coercive public education campaigns, whether coming from governments or from private-sector book authors, probably have played a role in lowering birth rates—although it seems likely that this role has been small compared to the more “natural” effects of modernization, listed above.
Whatever the precise mix of causes, global population is now on track to stop growing before the end of this century.
Industrial Production
Let me briefly address a second source of exponential growth in the LtG model, besides population. The authors argued that the industrial system (energy, mining, and manufacturing) tends to grow exponentially even in the absence of population growth, because it puts some of its production into infrastructure that enables increased production (a “positive feedback”). To support this claim they provided a chart (on page 38) showing that per-capita industrial production rose steeply between 1950 and 1968.
I think the authors would agree that we should use caution when basing a 130-year future projection on less than two decades of empirical evidence. As for the theoretical positive-feedback argument, I see the point but I should also think that growth in industrial production would be limited by consumer demand, and I doubt that per-capita consumer demand for energy or manufactured goods tends to grow exponentially without limit. Once people have achieved a reasonable level of physical safety and comfort, they tend to shift their spending from energy and material goods into services. Today (again with 50 years of hindsight) we can see that per-capita energy use is no longer growing in rich countries, even while it continues to grow in many middle-income countries. This is not the pattern we would expect if the overall slowdown in the growth of per-capita energy use were due to resource constraints.
I suspect that a similar pattern holds for industrial production overall, but I can’t seem to find a convenient data source for global industrial production trends. In the U.S., per-capita industrial production has been essentially flat for the last 20 years:

This behavior is consistent with the hypothesis that industrial production, like energy use, is something that grows rapidly only until a society crosses a certain standard-of-living threshold.
In Summary
The Limits to Growth was a groundbreaking and reasonable attempt to extrapolate the rapid growth of the post-war decades into the 21st century. But it was very much a product of its time, and times have changed. Today, with 50 years of hindsight, it’s not hard to look back and find serious flaws in the LtG model’s assumptions. Positive feedbacks do not drive fast exponential growth under as wide a range of conditions as LtG assumes.
It seems likely that widespread concern about run-away exponential growth during the 1960s and 70s was partly responsible for the slowdown in population and industrial growth that has occurred since. Perhaps the publication of LtG played a small role in steering the world away from the catastrophe it predicted. Mostly, though, the slowdown has resulted from “natural” social factors that LtG underestimated or overlooked.
This is not to say that Malthusian pessimists are happy with the current situation. Many of them, including Dennis Meadows himself, believe that human population and industry are already in a state of overshoot, with unsustainable levels of industrial activity. It’s certainly true that present levels of fossil fuel combustion are not sustainable, but of course that isn’t the same thing. In any case, this view is more pessimistic than the conclusions expressed in The Limits to Growth, where the authors carefully avoided claiming the world would hit any limits within 50 years.
Meanwhile, the technological optimists are not happy either. Many of them would like to see human population grow well beyond 10 billion, with per-capita industrial production and energy use rising well beyond the levels now prevalent in rich countries. Perhaps that will happen some day. But it doesn’t seem to be where we’re headed during the current century, and I think that’s for the best until we make more progress toward weaning ourselves off fossil fuels.
Like it or not, humanity may have to wait a rather long time before getting a clear view of the ultimate limits to growth.


