Herman Kahn’s 1976 response to the Malthusian pessimists was mostly right.

The United States Bicentennial, back in 1976, was a pretty big deal. I turned 14 that year, and what I remember is a relentless barrage of red, white, and blue throughout the spring and summer months. Besides all the official commemorative stamps and coins and license plates and public events, the private sector jumped in with a profusion of bicentennial-themed products and promotions.
Much more recently, I learned of yet another 1976 product that tried to get a boost from all the hoopla: a fascinating book titled The Next 200 Years: A Scenario for America and the World. Its lead author was Herman Kahn (1922-1983), a physics-trained futurist best known for his writings about nuclear war (and as one of the inspirations for the movie character Dr. Strangelove). In 1961 Kahn founded a think tank called the Hudson Institute. The cover of The Next 200 Years lists Hudson Institute staff, naming two of them, as co-authors. But Kahn’s name is in bigger print.
We’re now 50 years into those next 200, so this seems like a good time to revisit Kahn’s book and see how well his “scenario” is holding up.
First, though, let’s set the scene. Although we often think of the 1970s as a pessimistic decade, 1976 was a relatively hopeful year in the United States. We’d gotten rid of Richard Nixon and gotten out of the Vietnam War. By July it was pretty clear that Jimmy Carter, a sincere optimist with a perpetual grin on his face, would be our next president. The 1973 oil shock was in the rearview mirror, and inflation was subsiding somewhat (temporarily, it turned out). Many people worried about pollution and resource scarcity and the destruction of nature, but Congress had taken action on those issues with a profusion of new laws, including the Endangered Species Act, a strengthened Clean Air Act and Clean Water Act, the National Environmental Policy Act (NEPA), and Corporate Average Fuel Economy standards.
Against this backdrop, Kahn and his collaborators wrote a cautiously optimistic book.
The book is framed as a response to what it calls “neo-Malthusian” concerns over exponential growth, dwindling resources, and worsening environmental damage. It rarely names any particular neo-Malthusians, but plainly one of its main targets is The Limits to Growth. That report, published four years earlier, predicted (with some qualifications) that the world was headed, within about a century’s time, for a future of “overshoot and collapse”. Unchecked exponential growth would lead to severe resource depletion and/or deadly pollution levels. These conditions would trigger the collapse of agriculture and industry, causing mass deaths from starvation and disease. Those who survive would be left poor, sick, and hungry.
Kahn’s rebuttal to this forecast was shrewd. As you might guess, he disputed that any essential resources would run short within a century, and he asserted that pollution could be kept within reasonable limits. Therefore, he concluded, rapid economic growth could continue for a while. Yet he did not dispute the more fundamental principle that growth has limits. He avoided the dire projections of The Limits to Growth by projecting a scenario in which economic growth slows down greatly, and perhaps even comes to a stop, over the next 200 years.
Here is Kahn’s summary, from page 4:
In our view, the application of a modicum of intelligence and good management in dealing with current problems can enable economic growth to continue for a considerable period of time, to the benefit, rather than the detriment, of mankind. We argue that without such growth the disparities among nations so regretted today would probably never be overcome, that “no growth” would consign the poor to indefinite poverty and increase the present tensions between “haves” and “have-nots.” Nevertheless, we do not expect economic growth to continue indefinitely; instead, its recent exponential rate will probably slow gradually to a low or zero rate. Our differences with those who advocate limits to growth deal less with the likelihood of this change than with the reasons for it.
Let’s now look at some details of Kahn’s scenario, and compare them to where we stand in 2026.
Population
In The Limits to Growth, the global population grows exponentially unless it is limited either by a high death rate or by society’s “deliberate action” to reduce the birth rate.
Kahn rejects both of those options and makes what must have been a startling claim to many readers in 1976: “the problem of exponential population growth appears almost to be solving itself” (page 27). He describes the demographic transition that has occurred in wealthier countries, in which “parents began to have fewer and fewer children, prompted by the reduced value of children as economic assets combined with the increased cost of rearing them and the erosion of traditional religious and social pressures for large families” (page 33). He explains that many demographers, including those at the United Nations Population Bureau, believe that such a transition is now (in the 1970s) underway in less developed countries, and is in fact likely to play out more quickly there. His scenario, then, projects that by 2176 the world population will have stabilized at a level of 15 billion, plus or minus a factor of 2. Kahn illustrates the 400-year global population trend on page 6 with a schematic S-curve:

From our perspective in 2026, we could nitpick a few details of this picture. It now looks like the global population trend will flatten toward the lower end of Kahn’s projected range, and sooner than he expected. Kahn doesn’t mention the possibility that, rather than stabilizing, the global population might peak and then go into decline, if the average fertility rate is not somehow fine-tuned to stay just at the replacement level. Nor does he fully describe the causes of demographic transitions; for instance, he omits the role of increased educational and career opportunities for women.
But there is no denying that Kahn’s population scenario has turned out to be far more accurate than any of the scenarios in The Limits to Growth. The global population is no longer growing exponentially, and the reason has nothing to do with high death rates. Deliberate societal actions to reduce birth rates have played a temporary role in some countries, but for the most part, people in modernizing societies have simply chosen to have fewer children.
In 1992, three of the four Limits to Growth authors (Meadows, Meadows, and Randers) published an update to their book, titled Beyond the Limits. Though it doesn’t explicitly mention Kahn or his claim that exponential population growth may be solving itself, it does (finally) acknowledge the demographic transition. In fact, Beyond the Limits briefly discusses (on page 118) a scenario in which population is limited only by a natural demographic transition—and in that scenario the world’s population stabilizes right at Kahn’s estimated level of 15 billion. But the authors of Beyond the Limits emphasize that they consider this scenario purely hypothetical, because they expect resource and/or pollution limits to kick in before the demographic transition will flatten the population curve. Then, just as in the original Limits to Growth, they propose an abrupt, ad hoc limit on the birth rate as a means of keeping the population well below 15 billion.
Economic growth
After projecting that global population will follow an S-curve as in the illustration above, Kahn goes on to project that economic growth, expressed as GNP per capita, will follow a similar S-curve. And again, Kahn proposes that the curve will flatten not because of resource shortages or top-down policies but due to intrinsic factors and voluntary choices.
To defend this claim, Kahn does not cite any UN projections. Instead (on pages 30–31) he merely points to the increasing numbers of people in already-wealthy countries who seem to be content with what they have, including those who try to halt further local development (whom we would now call NIMBYs) and those who prefer a less material lifestyle (he mentions “flower children”). He cites social safety-net programs as one reason for the decreased need to accumulate personal wealth.
Kahn also raises the somewhat different point that as a society becomes wealthier, it shifts more of its economic activity away from production of material goods and into the service sector. This shift doesn’t necessarily slow GNP growth, but it does slow physical resource depletion and pollution.
For their part, the authors of Beyond the Limits firmly reject Kahn’s suggestion that economic growth would eventually be self-limiting: “We see little ‘real-world’ evidence that the richest people or nations have lost interest in getting richer” (page 118).
So who has been proven right, at least as of 2026?
Per-capita economic growth in wealthy countries has slowed over the last 50 years, though it certainly hasn’t stopped. I’d say the jury is still out over whether it will be more or less self-limiting over the next 50 to 150 years.
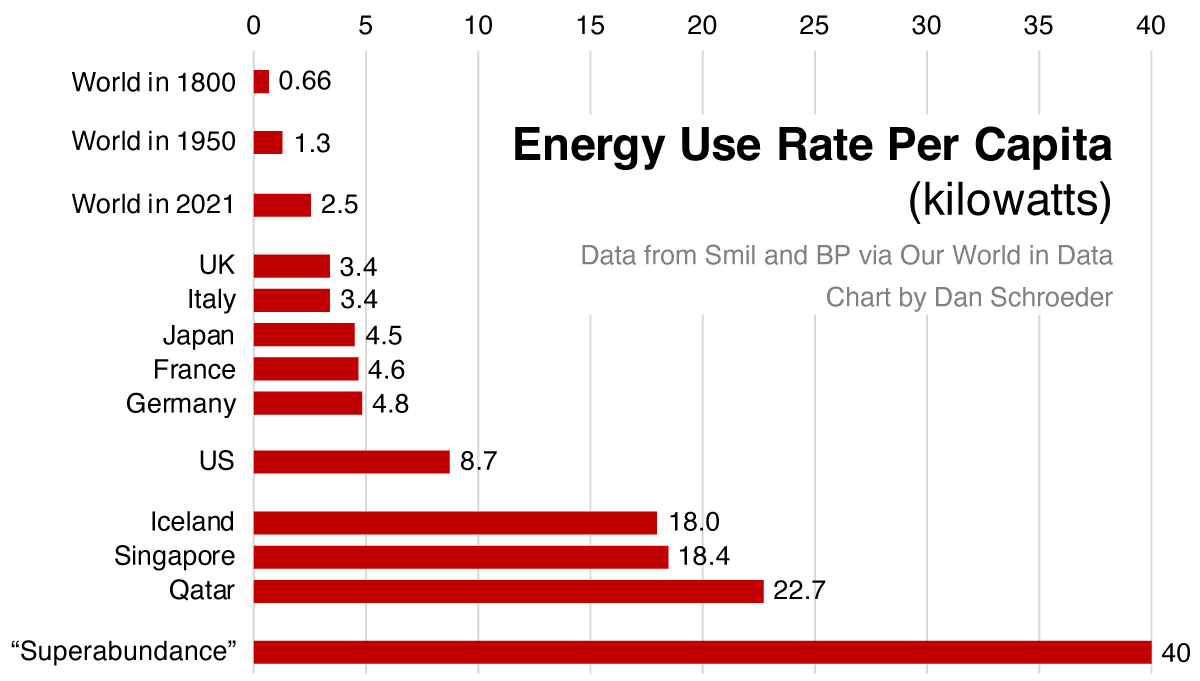
If we look more narrowly at the consumption of physical goods, though, I think the last 50 years have mostly vindicated Kahn. Per-capita energy consumption, in particular, really has flattened in wealthy countries. And it’s energy and other physical resources that determine whether society is on a sustainable trajectory. Of course, there’s no guarantee that the flattening of physical consumption will persist in wealthy countries for another 150 years, or that it will happen in all other countries once they become wealthy.
Energy
Even if world-wide energy use flattens, there’s still the question of how long fossil energy resources will last, and whether we can deploy suitable substitutes when they become necessary. This question was on many of our minds back in the 1970s.
The Next 200 Years devotes a full chapter to energy. First Kahn gives some numerical estimates of future energy demand (page 62). His estimate for the year 2025 is 1.2 × 10¹⁸ Btu (about 350,000 TWh), which has turned out to be about twice the actual value.
Then Kahn goes through a long list of energy technologies, assessing the prospects for each in turn. Here is a sampling of notable remarks:
[P]otential U.S. resources of oil, gas and coal are sufficient to supply the energy needs of this country for more than 150 years, given our projected GNP growth (page 64).
The consensus among scientists today is that the commercial feasibility of one of the magnetic fusion systems ... is likely to be established by the early 1990’s (page 77).
Within a decade or two, a battery-operated electric auto might even become competitive with today’s vehicles, at least for driving ranges up to 200 miles (page 80).
The current incandescent bulb will probably be replaced by other forms of lighting which will be 10 times more efficient (page 81).
There’s also this amazing chart (on page 70) of projected costs of renewable energy technologies, based on data from a 1973 report by the Mitre Corporation and Battelle Columbus Laboratories:

(Here “solar thermal” refers to electricity generation, while “H.C.B.” means solar heating and cooling of buildings.)
In most cases, Kahn tended to underestimate the time before new energy technologies would become affordable. On the other hand, the chart’s predicted dramatic drop in photovoltaic prices has turned out to be astonishingly accurate and of great consequence. The good news, in any case, is that we don’t need every energy technology Kahn discusses, because we can often substitute one form of energy for another.
Kahn summarized the global energy situation in these words:
Except for temporary fluctuations caused by bad luck or poor management, the world need not worry about energy shortages or costs in the future (page 83).
In 1976, this assessment ran strongly against the conventional wisdom. Even today, saying this out loud would be unfashionable. But I think virtually all energy experts would concede that Kahn was correct.
Space and other nutty stuff
If you want to blast Kahn for being a nutty techno-optimist, you’ll find plenty of ammunition in The Next 200 Years: ocean thermal energy conversion; foods made from wood; floating cities. And, of course, the darling of all nutty techno-optimists: space colonization.
On the very same page as the S-curve illustration (above) that defines the book’s main message, Kahn inserted (parenthetically) an outline of possible progress into space, including a “first serious move to colonize space” by 2025 and an “independent dynamic solar system society” by 2175. The book later explains that space colonization would allow further population growth (page 31), and would provide some insurance for the survival of the human race if there were a calamitous global catastrophe (pages 223–224).
Elon Musk’s promises notwithstanding, though, as of 2026 we are nowhere near making a serious move to colonize space.
But the key point to recognize about the book’s discussions of space is that they are entirely tangential to the earth-bound scenario that is the book’s main subject. Kahn is quite explicit in stating that “the transition we foresee (and the resolution of many current problems) can be accomplished by what is available to us here on earth, in terms of both living space and resources” (page 5).
Still, I think it was a lapse of judgment on Kahn’s part to indulge in speculations about space colonization (and floating cities and so on). In the context of this book’s main narrative, these speculations are distracting at best. When your goal is to persuade skeptics, why dilute your most solid arguments with flashy fantasies that are so easy to shoot down?
Miscellany
There’s quite a bit more in Kahn’s book: A chapter on raw materials, a chapter on food, and two chapters on environmental threats. Kahn praises (on pages 143–147) much of the recently enacted environmental legislation in the U.S., while lashing out (on pages 145–146) at environmentalists’ use of NEPA procedures merely to delay projects and run up costs.
The book devotes about a page to discussing the possible effects of rising carbon dioxide levels and global warming. Kahn’s assessment is that CO2 levels “will remain a closely watched potential threat for some time” but that the threat level “cannot be reliably predicted today; in 50 years or so, such predictions might be routine” (page 176). Rather than singling-out greenhouse-induced climate change as a unique cause for alarm, Kahn lists it as one of several long-term “possibilities for catastrophe”, alongside stratospheric ozone depletion, build-up of nitrogen and toxic metals in the biosphere, and genetically engineered diseases. It would take an expert science historian to sort out whether Kahn’s discussion of these threats was sufficiently balanced, given what was known in 1976.
The Next 200 Years makes no attempt either to emulate or to criticize the elaborate computer modeling that underlies The Limits to Growth. Whether this omission is a weakness or a strength is debatable. Computer models can often provide insight into the behavior of complex systems. Just as often, though, they can hide bad assumptions and give a false illusion of rigor. I find it notable that models of the sort used in The Limits to Growth, with hundreds of variables and hundreds of equations relating them, never caught on among social scientists.
Kahn’s tone throughout his book is calm and respectful. He acknowledges that the concerns and warnings raised by the neo-Malthusians are legitimate, and attributes their differing conclusions to misunderstandings rather than bad faith. And from what I can tell, Donella Meadows returned the favor by speaking respectfully of Kahn and assigning his book as required reading in some of her courses.
Five years after The Next 200 Years was published, economist Julian Simon published his book The Ultimate Resource, which made many of the same points but with less nuance, and in a style that was far more lively, entertaining, provocative, and polarizing. While Kahn tried to persuade the neo-Malthusians and even conceded many of their points, Simon tended to ridicule them. As a result, Simon developed an almost cult-like following, while Kahn’s earlier response to the neo-Malthusians has been largely forgotten. I wish it were otherwise, but polarization sells better than respectful dialog.